Anemometer Alignment
A wind turbine relies on its anemometer to detect the wind direction, so it can face directly into the wind. However, if its anemometer is misaligned, it can’t do this, which can cause significant problems such as loss of production and component fatigue.
Issues with anemometer alignment are common and detecting them can be difficult without access to the right data. AP Renewables SCADAScope platform provides a complete solution for detecting this type of issue, starting from gathering signal data from the turbine through to processing it and turning it into a fleet summary.
Anemometer Alignment is one of many metrics included in the SCADAScope Quality 365 report. If the anemometer is misaligned, even by 1 or 2 degrees, the rotor will be offset from the true wind direction and the wind turbine will produce less energy.
The Analysis
To detect if the anemometer is misaligned, we make two power curves: one when wind appears to be coming from the left, and another when the wind appears to be coming from the right. In a turbine with a perfectly centered anemometer, the left and right power curves should be very similar. If the anemometer is misaligned, the power curve will be consistently greater on one side than the other. That result also suggests that if the anemometer were correctly aligned, the wind turbine would follow the better power curve more of the time, leading to a measurable increase in annual energy production.
Example
Below is a power curve for a turbine with anemometer misalignment. Each point represents a 10-minute average. The points have been colored by the average wind direction during the 10-minute period. In general, when wind comes from the right (Red, >2°), the power curve tends to be higher than when wind comes from the left (Blue, <-2°).

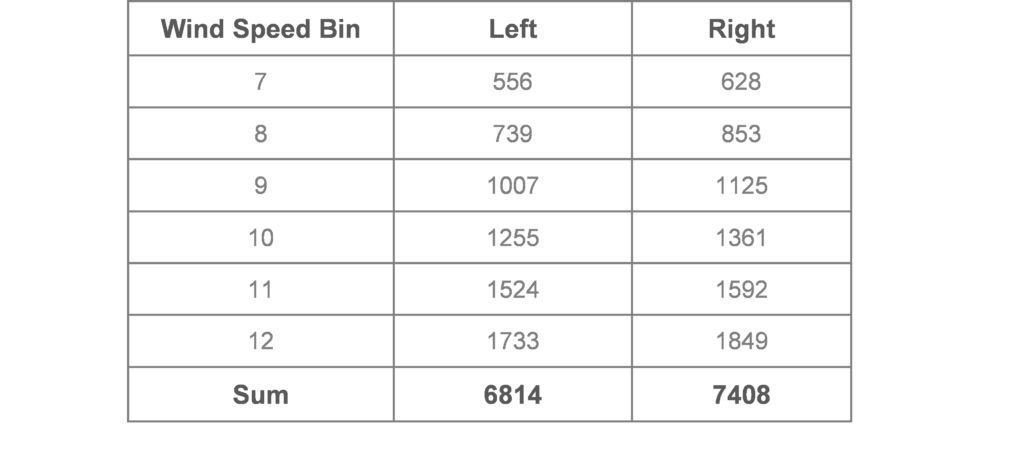
The effect is even more visible when we group by wind speed and direction:

It’s good to note that when the turbine is at max power, it will make the maximum regardless, so the misalignment does not impact the power as much, so to improve accuracy, we only take the data in lower wind speed range.

To make it a single number that can be easily compared across assets, we use the difference of the sums relative to the average:

In this example, we arrive at +8.35%. That doesn’t necessarily mean that if the anemometer alignment were corrected, the turbine would have produced exactly 8% more energy. That would depend on the wind speed distribution and several other factors. However, this gives us a useful metric of relative misalignment that can be compared across assets and over time.
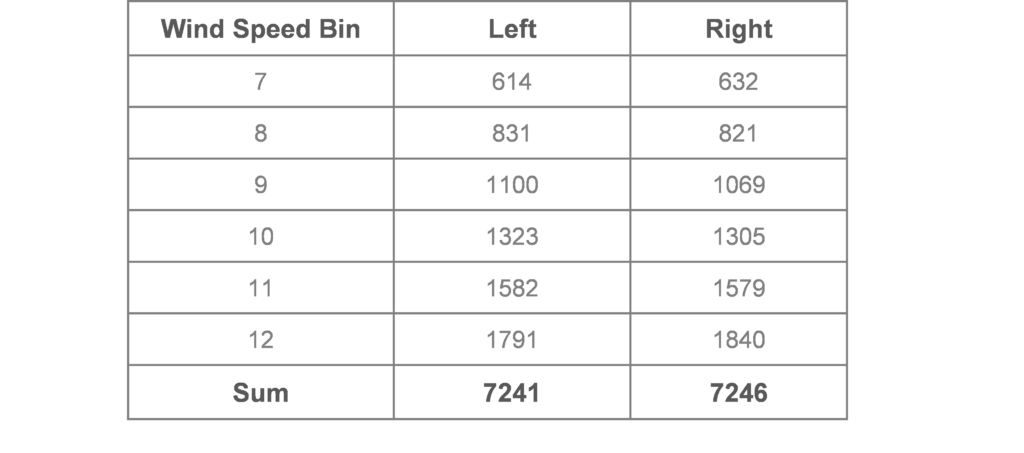
For comparison, below is the power curve for another turbine with a correctly aligned anemometer.

Computing the average power in each wind speed bin gave this result:

The final comparative result in this case is -0.1%
If you are concerned about production loss and damage from misaligned anemometers at your wind plants, SCADAScope Quality 365 reports highlight the turbines with anemometer alignment issues so that your team can address them accordingly. Based on resources, wind forecast and the severity, you may want to send a crew to fix a severe misalignment asap and decide that a minor problem could be added to the scheduled Preventive Maintenance punch list when it’s cheapest to perform it.
