Performance Analysis is the solution to so many burning questions that come up when managing a renewables site, such as grid control, DC faults, line loss, shading issues, and even warranty claims. Unfortunately during an analysis such as this there is usually a roadblock of getting the right data all in the same place.
Example Case
A solar site to prepare for a warranty claim and needed a year-long underproduction analysis. This would require actual and theoretical production, availability, irradiance, and temperature from the met mast to be aligned with the timeline of any known faults. Our goal was to explain what percentage of underperformance occurs when everything is seemingly running as expected. By gathering and analyzing this information, we demonstrated that the observed underperformance occurred mostly when all inverters were expected to be at peak performance. It was found to be related to damage during installation.
Procedure
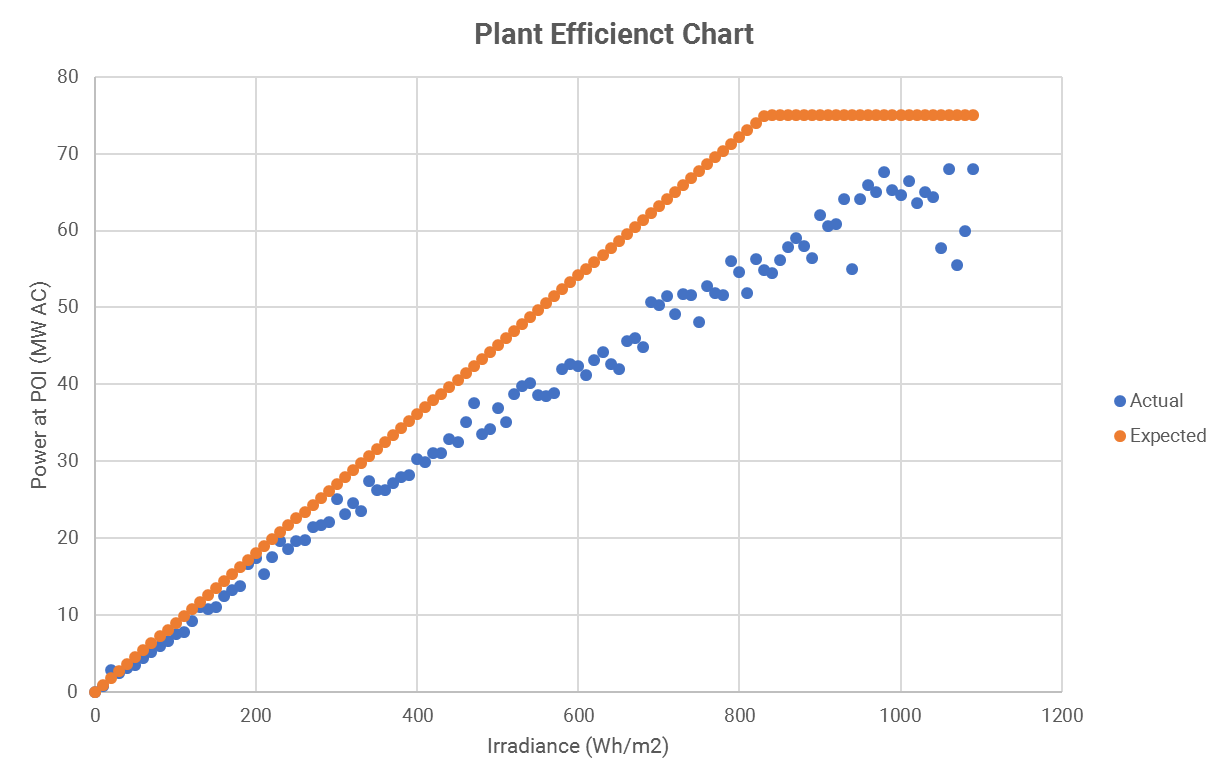
The calculation steps were to read the raw historian data (max sample rate of 1Hz), filter out the irregular data points to have a clean 10-minute trend for each point. To determine the theoretical production of each inverter, the factory curve was scaled by using the irradiance and temperature, then taking the minimum value between this and the available capacity as the final theoretical production value. The lost production for each 10-minute point was the difference between that theoretical and the actual production. The underperformance was then broken down further by time of day and weather to account for shading. Finally, the lost production was bucketed into the total loss due to each availability cause. This allowed us to isolate lost production that occurred when there was no other cause, and the inverters were expected to be at maximum performance.
Findings
We found the site had only reached its nameplate production for less than 20% of the time that all assets were available and weather conditions permitted nameplate production. It was also found that the most common cause of unavailability was DC faults, which accounted for approximately $75,000 of downtime loss per month as well.